Normally after checking the database and details in the logs and still not finding an issue, it is good to bring in server admins, but you can first check for additional bottlenecks and problems with the server.
With the Oracle environment, there is a tendency to assume that you have a dedicated machine for one Oracle database. However, that might always be the case.
Other databases and applications may also be running on the server. There might also be other versions of the Oracle database running.
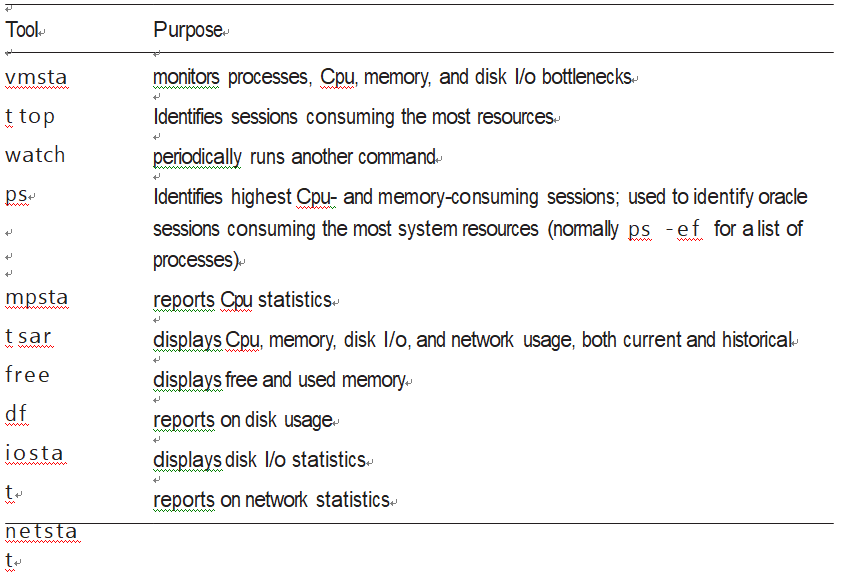
For the Linux environments, there are several tools available for monitoring resource usage. Table 16-1 summarizes the most commonly used OS utilities for diagnosing performance issues.
Being familiar with how these OS commands work and how to interpret the output will allow you to better diagnose server performance issues, especially when it is a non-Oracle or even a non-database process that is hindering performance for everything on the server.
Table16-1.PerformanceandMonitoringUtilities

When diagnosing performance issues, it is useful to determine where the OS is constrained. For instance, try to identify whether the issue is related to CPU, memory, or I/O, or a combination of these.
Tip With all of these commands, you can use the command with the –help parameter to get usage and additional parameters.

Leave a Reply